With the ever growing business needs, today’s companies need their web applications to be robust and highly scalable.
Before deploying the JMS resources in production environment, companies do performance testing.
This post provides a brief insight about how we can load test to measure performance of a Weblogic Server JMS resource using JMeter.
You can download the apache JMeter from the below site.
https://jmeter.apache.org/download_jmeter.cgi
Steps:-
1. Create a Weblogic JMS queue.
You can refer the below post for creating a JMS queue in WebLogic server.
https://weblogic-wonders.com/weblogic/2010/11/30/weblogic-jms-feature-using-a-queue
2. Start the Apache JMeter
Execute jmeter.bat from <JMETER_HOME>/bin
3. Define a Thread Group from the JMeter console:
Click on the Test Plan –> Add –> Threads (Users) –> Thread Group
Define the below properties:
Number of threads (Users): Number of users to be defined.
Ramp-Up Period : Leave the default value of 1 second. This property tells JMeter how long to delay between starting each user.


4. Create a sampler for JMS Point-to-Point
Add a sampler for the JMS Point-to-Point to be load tested by right clicking on the created Thread Group –> Sampler –> JMS Point to Point.
Define the below properties:
QueueConnection Factory : This should be the connection factory created in the Weblogic JMS resources section
JNDI name Request Queue: This should be the JMS Queue created in the Weblogic JMS resources section
Initial Context Factory: weblogic.jndi.WLInitialContextFactory for WebLogic Server
Provider URL: Server URL ex: t3://localhost:8001


5. Create a JMeter Thread Group listener:
Right Click on the Thread Group –> Add –> Listener –> Graph Result.

6. Start the load test
Start the load test by click on the Start icon from the JMeter.
7. Test the result.
You can observe the result from the graph output.

Enable log viewer: Click on Options tab –> Log viewer

Further reading:
http://jmeter.apache.org/usermanual/build-jms-point-to-point-test-plan.html
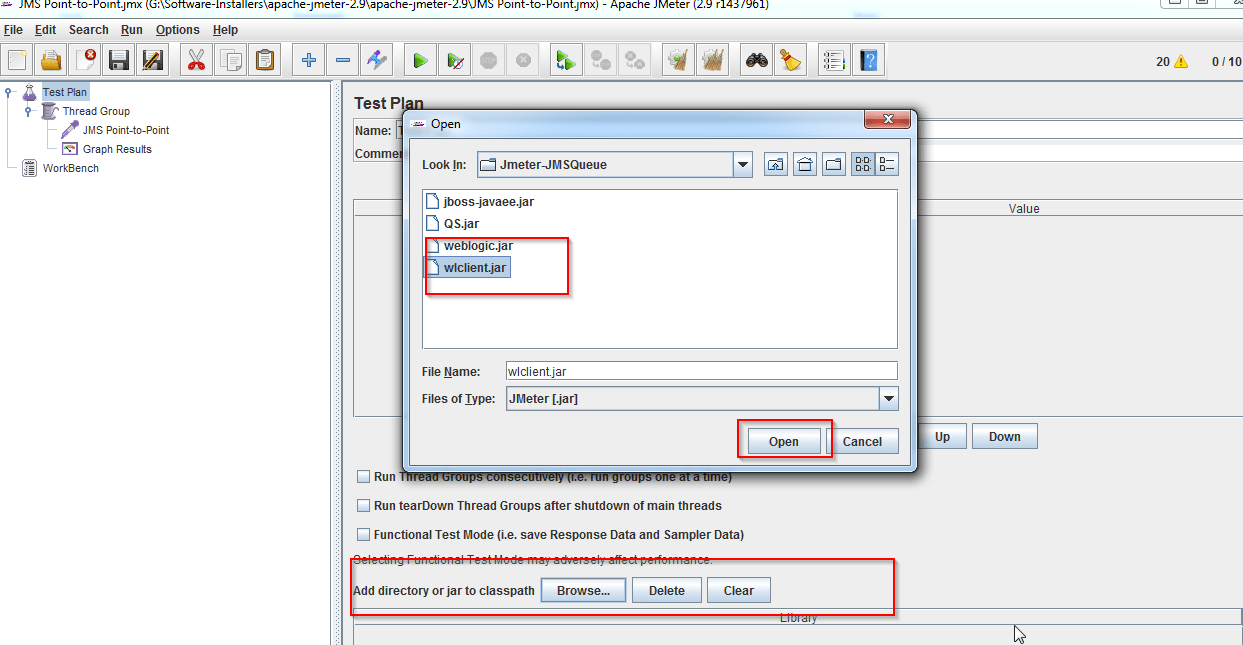
Common problems you might run into:
1.
Caused by: java.lang.ClassNotFoundException: weblogic.jndi.WLInitialContextFactory
Caused by: java.lang.ClassNotFoundException: weblogic.security.acl.UserInfo
Remedy: Make sure you put <WEBLOGIC_HOME>wlserver_12.1serverlibwlclient.jar in the classpath.
2. If you are using http protocol to connect to weblogic server, you might run into the below exception.
ERROR – jmeter.protocol.jms.sampler.JMSSampler: Couldn’t connect to the specified host : Tunneling result unspecified – is the HTTP server at host: ‘127.0.0.1’ and port: ‘8001’ a WebLogic Server? javax.naming.NamingException: Couldn’t connect to the specified host : Tunneling result unspecified – is the HTTP server at host: ‘127.0.0.1’ and port: ‘8001’ a WebLogic Server
Remedy: Enable http tunneling for the WebLogic Server.
http://docs.oracle.com/cd/E17904_01/web.1111/e13701/web_server.htm#CNFGD217
Cheers,
Wonders Team.
A very useful and complete tutorial. Great Work!
thanks Alassio for your appreciation!